COGNITA LABS / INTERACTIVE OSCILLOMETRY LAB
See the mechanics of oscillometry in action
Explore the airways. Follow the signal. Understand the measurement.
FROM MECHANICS TO INTERPRETATION
Mechanics to interpretation
How to read the reference chart
Adjust physiology or choose a pattern. The line on the bell curve shows the selected parameter’s Z-score. During asthma/COPD comparison, blue shows pre-bronchodilator and black shows post-bronchodilator. Pre view hides the black markers on both the curve and bars.
X5 is reversed: more negative Z-scores move right. For the other parameters, higher Z-scores move right. Yellow begins at Z +1 and red at +1.64 (−1 and −1.64 for X5).
How these teaching Z-scores are calculated
Z = (simulated value − healthy-baseline value) / illustrative standard deviation. The baseline is centered at zero; fixed teaching standard deviations are R5 0.8, R20 0.6, R5−R20 0.6, X5 1.2, AX 5 and Fres 3, in each parameter’s displayed units. This is an idealized Gaussian curve, not a population histogram. These are not patient Z-scores or diagnostic cutoffs; clinical reports require an appropriate reference equation and patient inputs.
Change the physiology
Baseline airway caliber and respiratory stiffness.
Illustrative adult patterns. Slider percentages are model settings, not measured narrowing or disease severity.Pre view: blue markers only. Post view: blue pre and black post markers. Asthma illustrates a substantial response; COPD illustrates minimal response, not absence of possible responsiveness. Slider edits retain the blue comparison.
Adjust either slider to zoom into the small airways. Narrowing changes airway caliber; stiffness shifts pink to violet and reduces expansion.
Clinical basis of these examples
Presets illustrate overlapping patterns, not diagnostic templates or population averages. The restrictive example includes modest peripheral involvement; this is possible in ILD but is not required for restriction. Reduced effective compliance in obstruction need not mean intrinsically stiffer tissue.
PulmoScan interpretation guide · Bhattacharyya et al., 2025 · Sugiyama et al., 2013 · ERS technical standards
Peripheral obstruction reduces effective compliance as oscillations reach less of the communicating lung. This model couples peripheral narrowing and heterogeneity to X5, AX and Fres. Within-breath ΔX5 is defined as mean inspiratory X5 minus mean expiratory X5. The phase difference is an illustrative mechanism, not a validated flow-limitation detector.
Gupta et al. · DOI 10.25259/KPJ_25_2020
Brashier & Salvi · DOI 10.1183/20734735.020514
Within-breath examples: ILD-like restriction has more negative inspiratory X5; COPD-like obstruction has more negative expiratory X5; asthma has no imposed difference. These illustrate reported group patterns, not rules for every patient. ΔX5 always means inspiration minus expiration here. Paredi et al., 2010
The asthma comparison illustrates bronchodilator responsiveness; preset changes are teaching examples, not fitted treatment-effect estimates. Oscillometry bronchodilator response in severe eosinophilic asthma
The breath, in real time
Flow PressureQuiet tidal breathing with visible 5 Hz and 20 Hz oscillations. The 5 Hz flow component responds to X5 and R5; higher-frequency detail is illustrative.
Reactance: cmH₂O·s/L. Inspiration and expiration values are illustrative half-breath means; the live measurement cards show whole-breath means.
No imposed within-breath difference.
UNDERSTANDING RESPIRATORY OSCILLOMETRY
Learn oscillometry with an interactive 3D lung model
This PulmoScan physiology lab by Cognita Labs connects respiratory mechanics with oscillometry measurements. Explore a three-dimensional airway tree, adjust peripheral narrowing and effective stiffness, and compare illustrative healthy, restrictive, obstructive, small-airway obstructive, asthma and COPD patterns.
What is oscillometry?
Respiratory oscillometry measures how the respiratory system responds to small pressure oscillations during quiet breathing. The relationship between oscillatory pressure and flow describes respiratory impedance, including resistance and reactance.
What do the parameters mean?
- R5 and R20
- Resistance at 5 and 20 Hz. R5 reflects distributed respiratory resistance; R20 is often used as an approximate indicator of central airway mechanics.
- R5−R20
- The frequency dependence of resistance, which can reflect uneven mechanics and peripheral airway dysfunction. It is not a direct measurement of isolated small-airway resistance.
- X5, AX and Fres
- X5 describes reactance at 5 Hz. AX summarizes negative reactance from 5 Hz to resonance. Fres is the frequency where reactance crosses zero.
How can I explore small-airway obstruction?
Move the peripheral narrowing slider to zoom into the small airways and see their caliber change. Select R5, R5−R20 or another live measurement to explore its anatomical association. Select it again to return to the previous view.
How do pre- and post-bronchodilator examples work?
The asthma preset illustrates a substantial response; the COPD preset illustrates minimal response. Blue markers retain pre-bronchodilator values and black markers show the post state. Individual responses vary; these are teaching examples.
Are these patient measurements?
No. The waveforms, parameter values and Z-scores are simulated. The bell curve uses illustrative normalization, not patient reference equations. Anatomical highlights illustrate concepts and do not locate measured lesions.
Continue learning: PulmoScan oscillometry interpretation guide · ERS technical standards for respiratory oscillometry · Clinical review of oscillometry
PulmoScan in practice
See the product, then rotate its CAD exterior in the lab.
Watch the PulmoScan demonstration ↗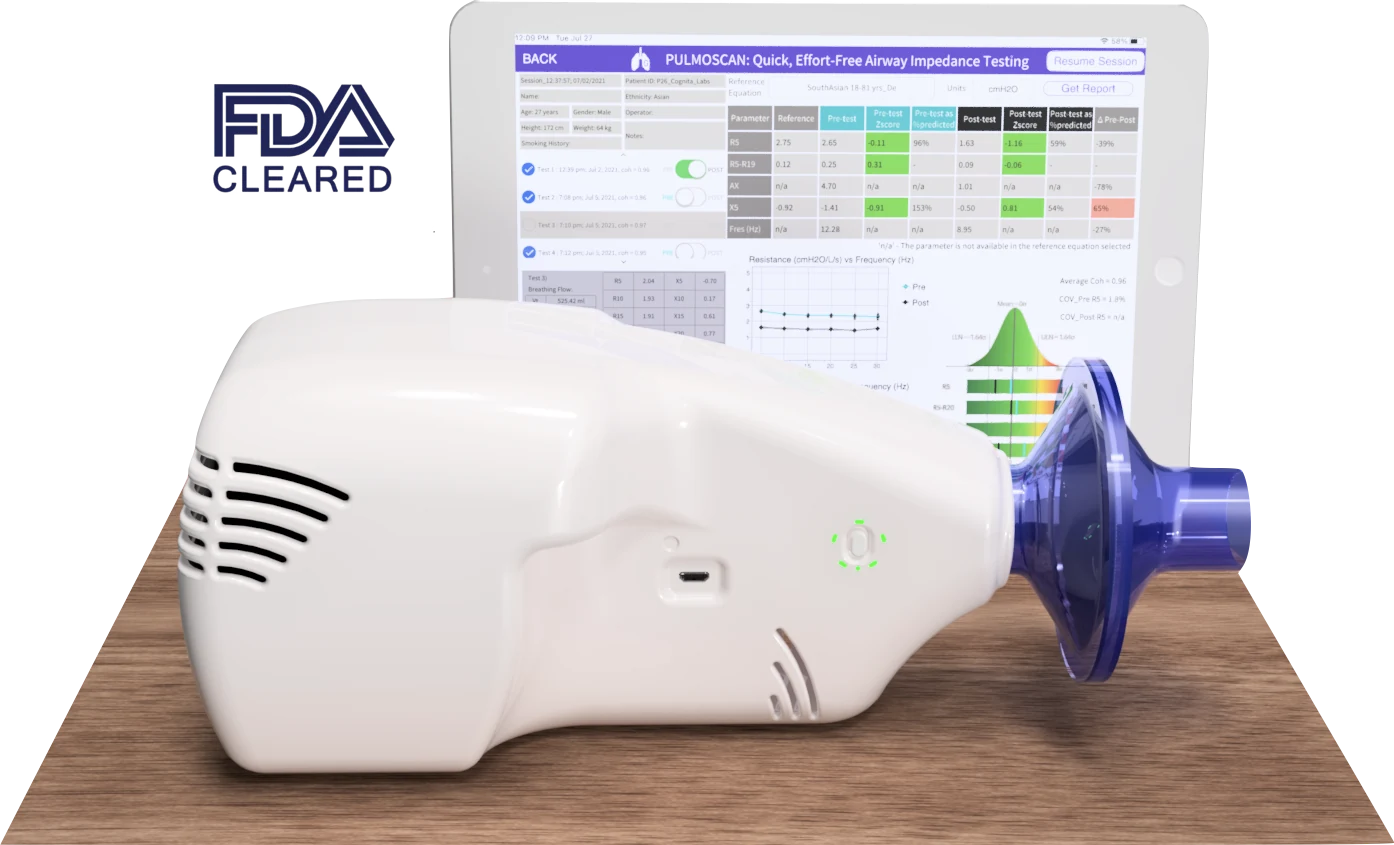
Adapted from “Anatomy of the airways” by E-learning UMCG. Materials, orientation and interactive deformation modified for this educational lab.
Original model ↗ · CC BY-NC-SA 4.0Noncommercial educational use. Anatomical model adaptations retain this license.
Upper-body anatomy: user-supplied upper-limb model, mirrored and made translucent. Head: “Infinite, 3D Head Scan” by Lee Perry-Smith / Triplegangers, CC BY 3.0; scaled and rematerialed.