
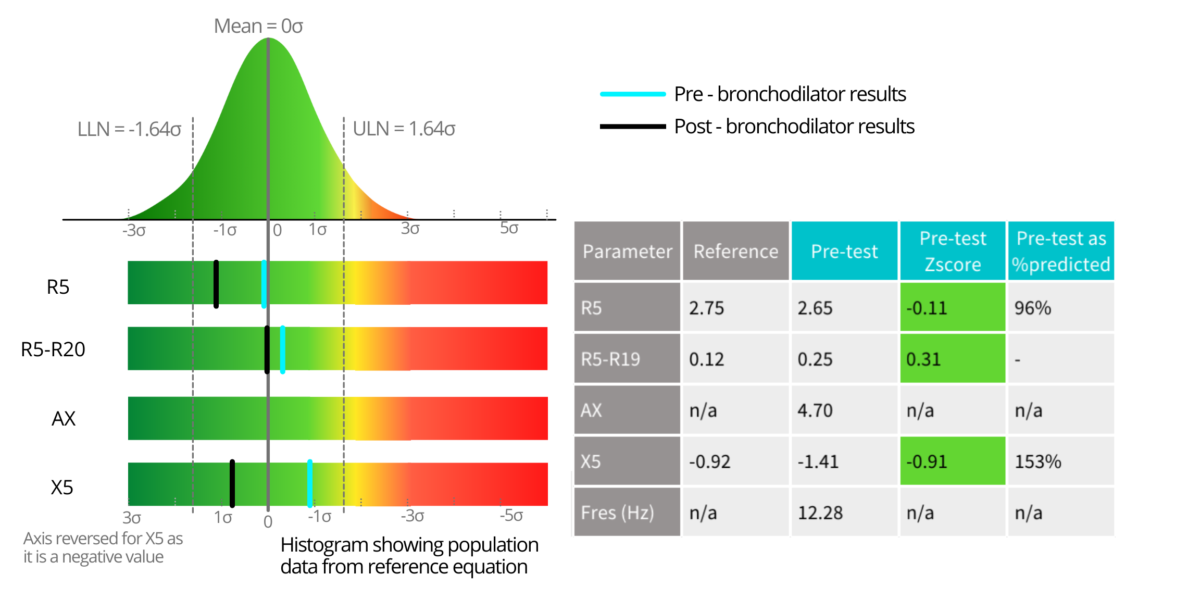
PulmoScan uses Forced Oscillation Technique (FOT) to deliver quick, effort-free measurements of airway impedance during relaxed breathing. The device analyzes how oscillating pressure waves (5-30 Hz) travel through the respiratory system, generating resistance (R) and reactance (X) curves.

This post walks you through interpreting oscillometry’s four key parameters, within-breath analysis, and bronchodilator reversibility using a step-by-step approach adapted from the oscillometry interpretation framework in the ERS technical standards [1], Gupta et al., 2021[2], and Brashier et al., 2015[3].
Step 1: Quality Check Before Interpretation
- COV (Coefficient of Variation): <10% for adults, <15% for children (R5 parameter)
- Repeat at least 3 tests for a valid session.
- Coherence: >0.85 ensures signal reliability
PulmoScan’s software incorporates reference equations from multiple published studies covering a range of ethnicities, enabling results to be compared against the most relevant population norms for each patient. The software displays Z-scores and percent predicted values for comparing the oscillometry test parameters, but the ERS technical standards [1] recommend using Z-scores from reference equations [4, 5]. PulmoScan software flags values beyond the upper limits of normal or ULN (1.645 Z-score) and grades severity automatically, supporting consistent, evidence-based interpretation.
Step 2: Start with R5: Total Airway Resistance
- R5 (resistance at 5 Hz) reflects the total resistance from central and peripheral airways.
- ↑ R5 suggests overall airway narrowing, as in asthma, COPD, or acute bronchoconstriction.
- Normal R5 means total airway resistance is within expected limits — but you must still check small airway parameters.
Step 3: Assess Small Airway Resistance: R5-R20
- R20 (resistance at 20 Hz) primarily reflects large/central airways.
- R5-R20 isolates peripheral airway resistance.
- ↑ R5-R20 means small airway narrowing, often the earliest sign of obstructive lung disease.
- A normal R20 but elevated R5-R20 can point to isolated small airway disease, which spirometry often misses.

Step 4a: Look at X5: Small Airway Reactance
- X5 (reactance at 5 Hz) reflects the elastic and inertial properties of peripheral airways.
- More negative ↑ X5 values mean stiffer, less compliant small airways.
- Seen in restriction (fibrosis, interstitial lung disease) and in severe small airway obstruction (asthma, COPD).
Step 4b: Review AX: Area under the Reactance curve
- AX is the integrated area under the reactance curve from 5 Hz to Fres (resonant frequency or zero-crossing).
- ↑ AX indicates greater small airway dysfunction and can amplify findings from X5.
- AX is highly sensitive to early changes in the small airways.
Step 5: Identify the Pattern
Obstructive
- ↑ R5, ↑ R5–R20, ↑ X5, ↑ AX
- Seen in asthma, COPD, bronchiolitis
- Normal- R20, ↑ R5–R20, ↑ X5, ↑ AX
- Often early asthma/COPD

Restrictive
- Normal/slightly ↑ R5, normal R5–R20, markedly ↑ X5, ↑ AX
- Seen in fibrosis, ILD, hyperinflation

Obstructive with central airway component
- ↑ R5, ↑ R20, ↑ X5, ↑ AX
- Normal R5–R20
- Seen in asthma
For more disease cases, please refer to the examples provided in Gupta et al., 2021[2].
Step 6: Use Within-Breath Parameters for Deeper Insight
PulmoScan can analyze inspiratory vs. expiratory phases within each tidal breath, revealing patterns invisible to whole-breath averages. These within-breath parameters help detect flow limitation:
Expiratory Flow Limitation (EFL)
- Defined as markedly higher expiratory resistance/reactance compared to inspiration.
- EFL is a hallmark of COPD, severe asthma, and other obstructive diseases.
- Mechanism: During expiration, small airways collapse prematurely, trapping air.
- Oscillometry signal:
- R5 (exp) markedly higher than R5 (insp)
- More negative X5 (exp) than X5 (insp)
- Often seen with dynamic hyperinflation.
Inspiratory Flow Limitation (IFL)
- Characterized by higher inspiratory resistance/reactance compared to expiration.
- Suggestive of restrictive mechanics, including upper airway restriction, interstitial lung disease, and chest wall disorders.
- Mechanism: Increased stiffness or structural limitation reduces inspiratory compliance.
- Oscillometry signal:
- R5 (insp) markedly higher than R5 (exp)
- X5 more negative during inspiration.
Why It Matters:
- Whole-breath results may appear borderline or normal, but within-breath analysis can reveal dynamic airway behavior that guides diagnosis and therapy.
- EFL detection can prompt earlier COPD intervention.
- IFL patterns can push work-up toward restrictive or neuromuscular causes rather than obstructive disease.
Step 7: Bronchodilator Reversibility with PulmoScan
PulmoScan can test reversibility without repeated forced maneuvers. Per ERS guidance, a significant change is:
- R5 ↓ by ≥40%
- X5 ↑ by ≥50%
- AX ↓ by ≥80%
By combining whole-breath parameters with within-breath flow limitation analysis, PulmoScan helps clinicians move beyond a simple “normal/abnormal” report and toward a nuanced, physiology-driven interpretation that can:
- Detect early disease
- Differentiate between obstructive and restrictive mechanics
- Identify dynamic airway collapse or stiffness patterns
- Track patient response over time, in the clinic or at home.o